TECHNICAL ANALYSIS: ETH 22.02.2022


TECHNICAL ANALYSIS: ETH 22.02.2022
Ethereum extended decline below the $2,700 support against the US Dollar. ETH price is struggling and might even decline below the $2,500 support.
Ethereum started a major decline below the $2,800 support level.
The price is now trading below $2,700 and the 100 hourly simple moving average.
There is a key bearish trend line forming with resistance near $2,700 on the hourly chart of ETH/USD (data feed via Kraken).
The pair could recover, but the bears might remain active near $2,650 and $2,700.
Ethereum Price Turns Red
Ethereum failed to correct and recover above the $2,750 resistance zone. ETH settled below the $2,750 level and the 100 hourly simple moving average.
As a result, there were additional losses below the $2,650 support. The price gained pace and even declined below $2,550. A low is formed near $2,511 and the price is now consolidating losses. An immediate resistance on the upside is near the $2,560 level.
The 23.6% Fib retracement level of the recent decline from the $2,752 swing high to $2,511 low is also near the $2,560 level. The next major resistance is near the $2,650 level.
Besides, the 50% Fib retracement level of the recent decline from the $2,752 swing high to $2,511 low is near the $2,650 level. The main resistance is now forming near the $2,720 level and the 100 hourly simple moving average. There is also a key bearish trend line forming with resistance near $2,700 on the hourly chart of ETH/USD.
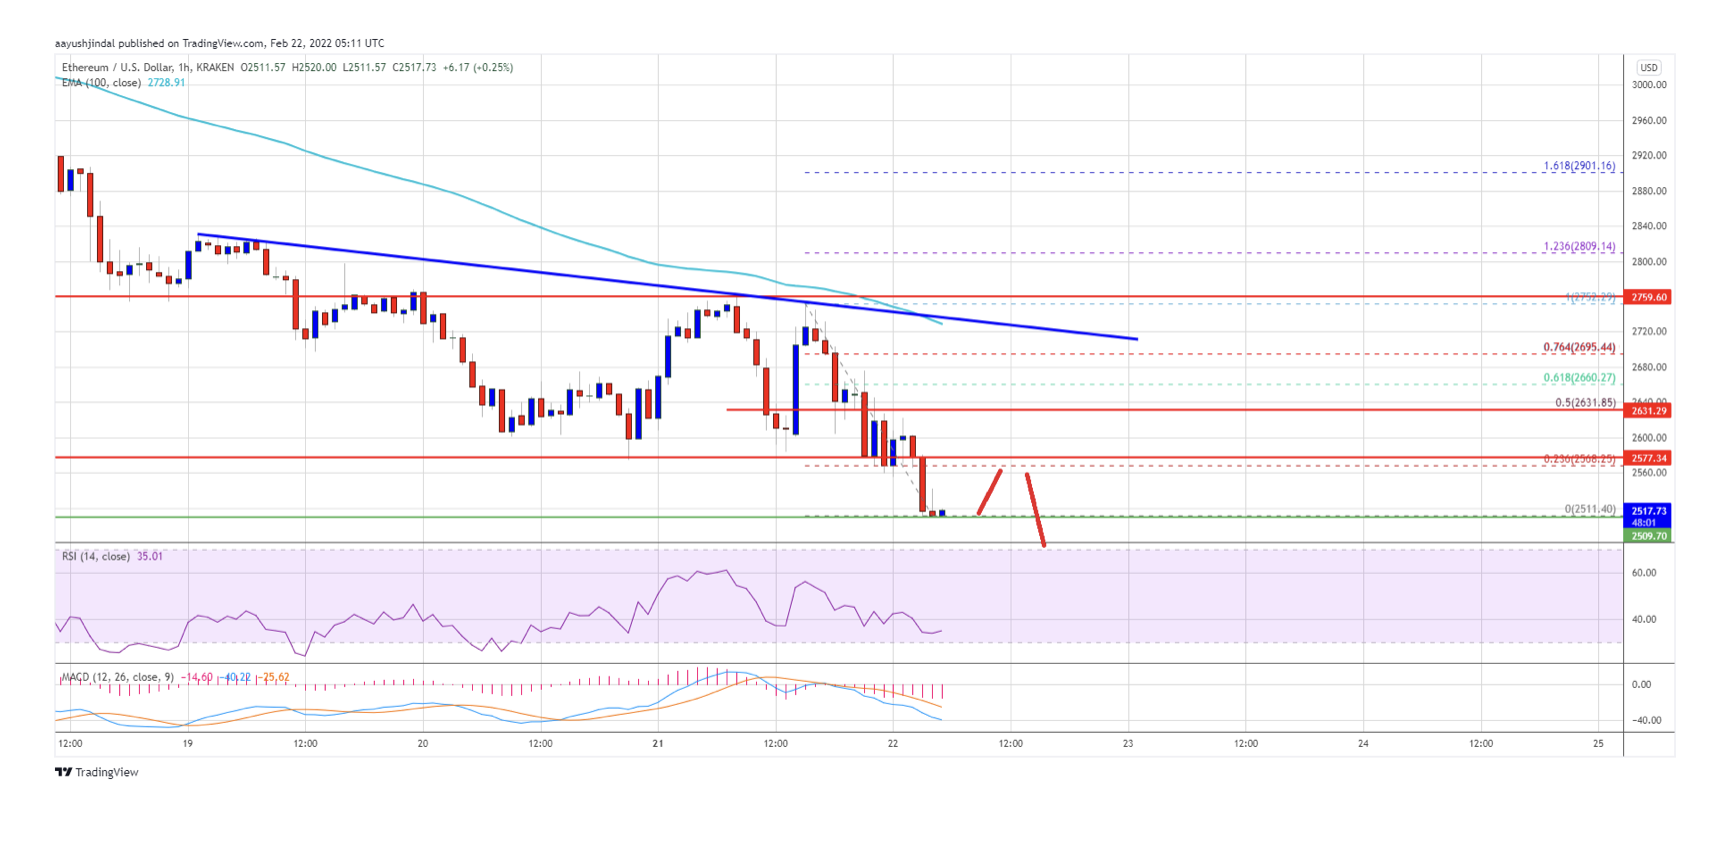
A clear move above the $2,720 might start a steady increase. In the stated case, the price could rise towards $2,880 resistance zone or even $3,000.
More Losses in ETH?
If ethereum fails to start a recovery wave above the $2,650 level, it could start another decline. An initial support on the downside is near the $2,510 level or the recent low.
The next major support is near the $2,500 level. A downside break below the $2,500 could spark another major decline. The next major support is near the $2,420 level. Any more losses might call for a move towards $2,350 in the near term.
Technical Indicators
Hourly MACD – The MACD for ETH/USD is gaining pace in the bearish zone.
Hourly RSI – The RSI for ETH/USD is now below the 50 level.
Major Support Level – $2,500
Major Resistance Level – $2,650
Disclaimer: The information presented in this article does not constitute investment advice and based on it, no decisions should be made for the purchase and sale of virtual currencies. The facts and circumstances that are the subject of analysis in the article are publicly available information. The analyses that are cited or performed by the team of BONEXX EOOD are stated for informational and educational purposes only. Investing in virtual currencies is associated with high risk, as you can lose all invested funds. We urge you to consult a licensed broker / financial advisor before deciding to buy and sell virtual currencies and make your own comprehensive study of the relevant facts and circumstances on the basis of which to make such an investment.