TECHNICAL ANALYSIS: ETH 10.03.2022


TECHNICAL ANALYSIS: ETH 10.03.2022
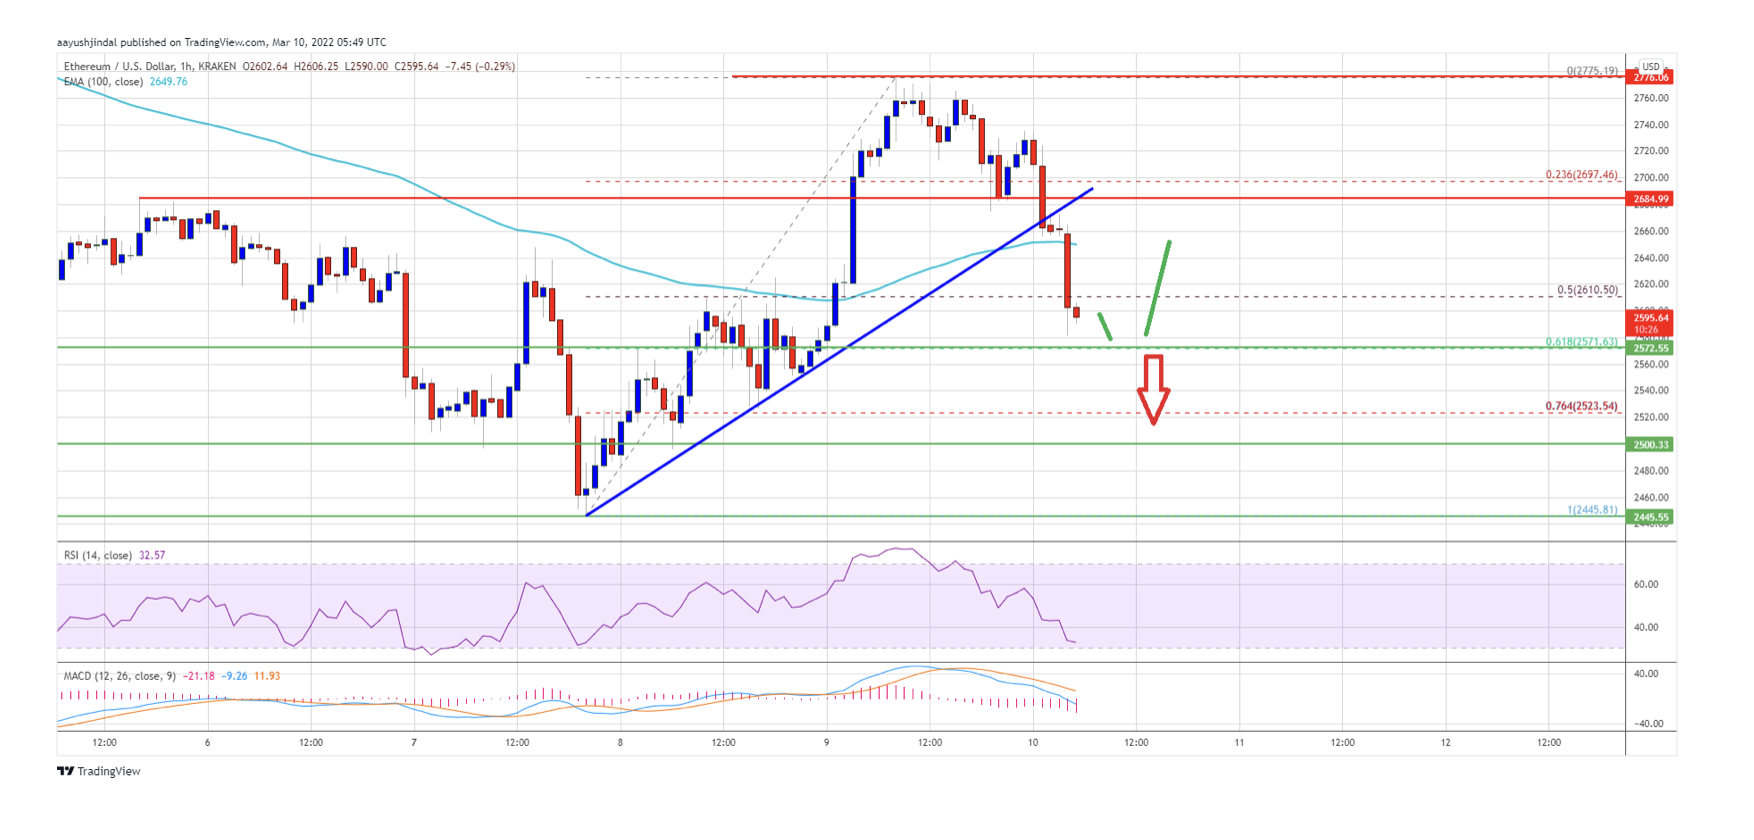
Ethereum failed to surpass $2,780 and corrected lower against the US Dollar. ETH price must stay above $2,570 to start a fresh increase in the near term.
Ethereum struggled to clear the $2,780 zone and corrected gains.
The price is now trading below $2,650 and the 100 hourly simple moving average.
There was a break below a key bullish trend line with support near $2,660 on the hourly chart of ETH/USD (data feed via Kraken).
The pair could extend decline if it fails to stay above $2,570 and $2,550.
Ethereum Price Corrects Lower
Ethereum extended increase above the $2,700 level. ETH even cleared the $2,750 resistance level, but it faced a strong resistance near $2,780.
A high was formed near $2,775 and the price started a downside correction. There was a break below the $2,700 and $2,650 levels. Ether price settled below $2,650 and the 100 hourly simple moving average. The price declined below the 50% Fib retracement level of the upward move from the $2,445 swing low to $2,775 high.
Besides, there was a break below a key bullish trend line with support near $2,660 on the hourly chart of ETH/USD. The pair is now approaching the $2,570 support zone. It is near the 61.8% Fib retracement level of the upward move from the $2,445 swing low to $2,775 high.
If ether price stays above the $2,570 support, it could start a fresh increase. On the upside, an initial resistance is near the $2,620 zone.
The first major resistance is seen near the $2,650 level and the 100 hourly simple moving average. The next major resistance is near the $2,780 level, above which the price could accelerate higher. In the stated case, the price might rise towards the $2,880 level.
More Losses in ETH?
If ethereum fails to start a fresh increase above the $2,650 level, it could continue to move down. An initial support on the downside is near the $2,570 level.
The next major support is near the $2,550 level. A close below the $2,570 and $2,550 support levels might push the price further lower. In the stated case, the price could revisit $2,445.
Technical Indicators
Hourly MACD – The MACD for ETH/USD is now gaining pace in the bearish zone.
Hourly RSI – The RSI for ETH/USD is now below the 50 level.
Major Support Level – $2,570
Major Resistance Level – $2,650
Disclaimer: The information presented in this article does not constitute investment advice and based on it, no decisions should be made for the purchase and sale of virtual currencies. The facts and circumstances that are the subject of analysis in the article are publicly available information. The analyses that are cited or performed by the team of BONEXX EOOD are stated for informational and educational purposes only. Investing in virtual currencies is associated with high risk, as you can lose all invested funds. We urge you to consult a licensed broker / financial advisor before deciding to buy and sell virtual currencies and make your own comprehensive study of the relevant facts and circumstances on the basis of which to make such an investment.